Acknowledgment of Country
The author acknowledges the Traditional Owners of Country throughout Australia and acknowledges their continuing connection to land, waters and community. The author pays his respects to the people, the cultures and the Elders past and present.
Disclaimer: This post focuses primarily on migrant cultures. It is not about the Aboriginal peoples who lived on these lands long before European arrival, nor the movements and experiences of Aboriginal communities during and after European settlement.
Introduction
A new census is scheduled for August 2026, coinciding with ongoing debates and politicisation regarding migration and multiculturalism in Australia. In this environment, the following is an inquiry into our region’s history to see how diverse our region is and how the results of the 2026 census may show any change.
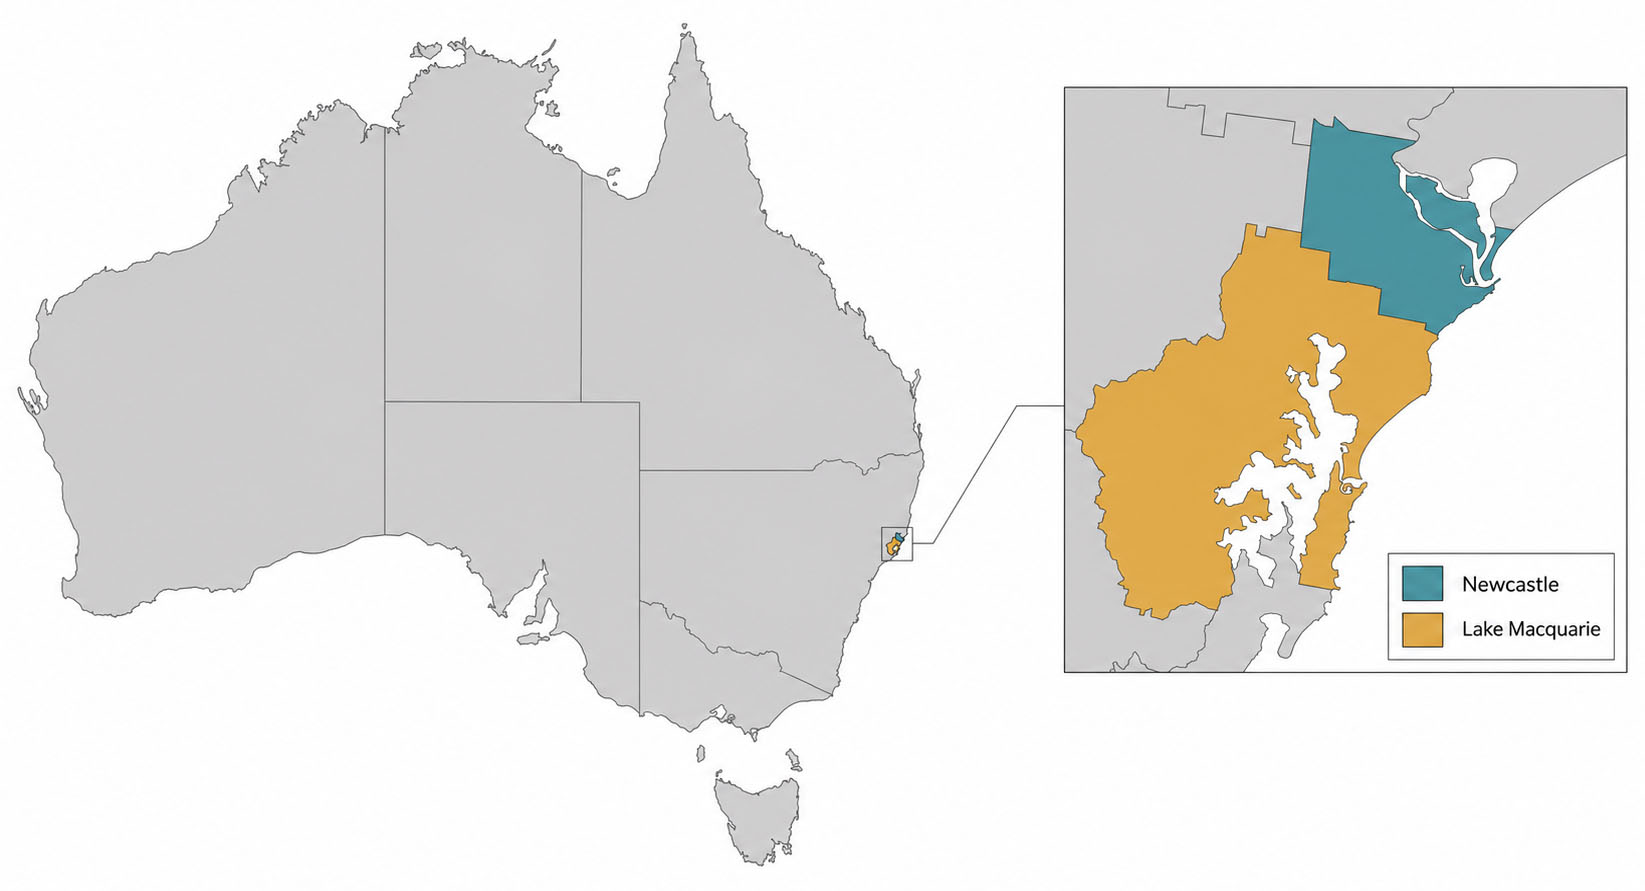
Life in the region
Mitochondrial DNA Evidence shows that human presence on the Australian East Coast goes back to at least 47,000 years (Tobler et al., 2017). Archaeological evidence indicates that the area now known as Newcastle and the Lake Macquarie district has been inhabited by Aboriginal peoples for approximately 6,716 to 6,502 years, prior to the arrival of new settlers in the late eighteenth century.
In 1797, during early British expeditions in Australia, Lieutenant John Shortland entered the region and named the Hunter River in honour of Governor John Hunter of New South Wales. The First Official British Settlement at Coal River was in 1801, as a penal settlement which was soon abandoned. A permanent settlement was re-established in 1804. The 1820s saw the closure of the penal settlement, and the opening up of the region to free settlers. The region subsequently attracted multiple waves of migration due to its abundant resources.
Drawing on census data, the following account outlines the history of migrations after the early 19th-century British settlements in what is now known as Newcastle and the Lake Macquarie district. However, before going any further, it is essential to acknowledge the harms and injustices associated with the settlement history, as well as the fact that this land was never ceded and remains Aboriginal land.
European Settlement
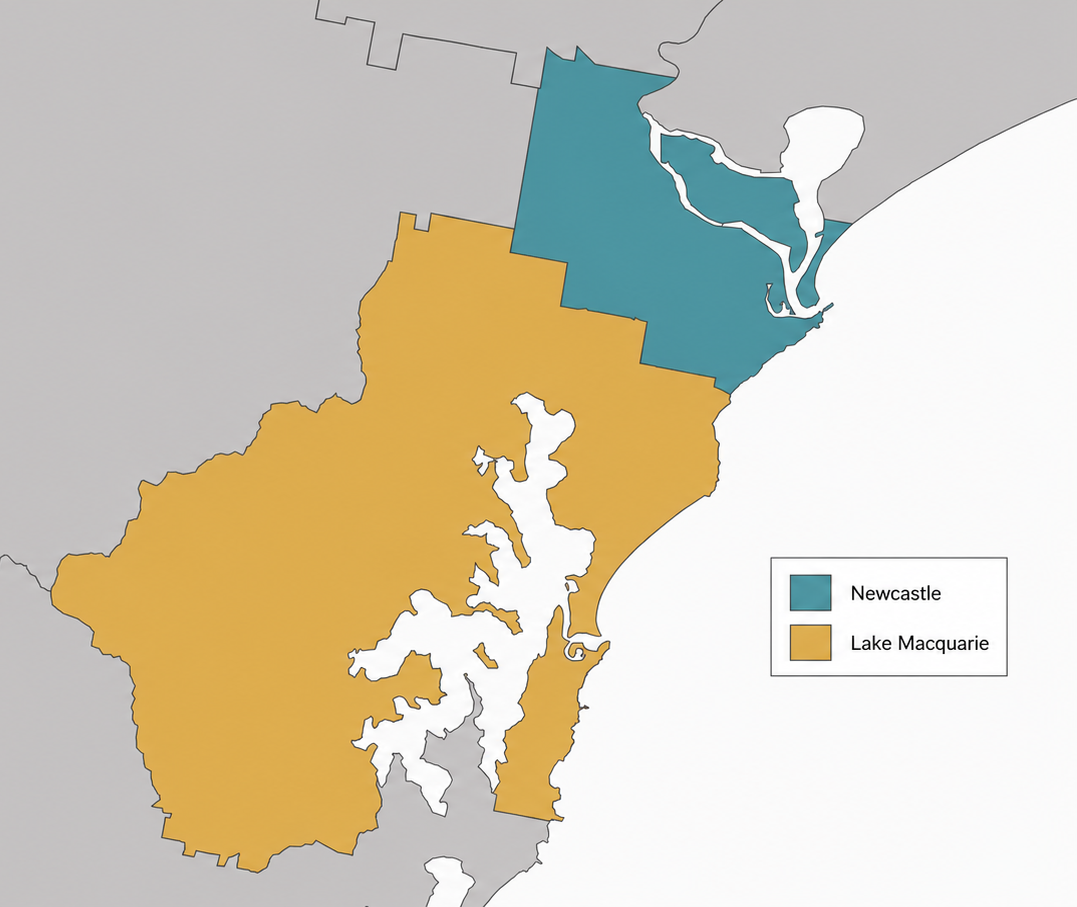
The census data for Newcastle and Lake Macquarie, collected in 1851, indicate a predominantly migrant settlement. The population primarily consisted of British migrants and individuals born in the colony. Despite this apparent uniformity, there was notable diversity, including individuals from England, Wales, Ireland, Scotland, other British dominions, and several unidentified countries. Discriminatory and selective immigration policies, as well as settlement methods, maintained a predominantly European community in Newcastle (Tsounis 1975, p.47).
However, the community was more diverse than is generally assumed. For example, the 1966 census highlights a prevalence of southern Europeans, particularly Greek, Italian, and Yugoslav populations, in the inner suburbs, and German and Dutch settlements in the outer suburbs. (My 1976; 1970; Galvin 1976; 1980).
Population Change
In 1981, Newcastle, defined by the contiguous built-up area within the municipalities of Newcastle and Lake Macquarie, had a population of 284,670. By June 2021, the population for the same area was reported as 388,131. Accordingly, the comparison between the two latest census data shows that diversity deepened through a larger second generation, rapid growth in Asian born populations, and the use of non-English languages in more households. In 2021, statistics suggest that 27.3% of residents had at least one overseas-born parent (Population of 106,986) and a 15% increase in households using a non-English language from 2016 (population of 14,203).

Towards a broader language mix

Language use provides the strongest evidence of diversification. English was the only language used at home by 91.8% of residents in 2001. However, this figure fell to 84.8% in 2021. Additionally, with demographic change, the identity of the most common non-English languages shifted over the past 25 years. In 2001, the leading languages were Italian, Macedonian, Greek, German and Polish, a profile strongly shaped by twentieth-century European migration. By 2021, Mandarin ranked first, followed by Macedonian, Arabic, Greek and Italian. This suggests that the region’s linguistic, and therefore cultural, landscape became more diverse. Interestingly between 2016 and 2021 the number of households using a non-English language grew faster than the total population: their count rose by 15.5% and their share increased from 8.8% to 9.5%.
Patterns of language use provide compelling evidence of diversification. In 2001, 91.8% of residents spoke only English at home. By 2021, this proportion had declined to 84.8%.
While English remained the dominant language, demographic change shifted the identity of the most common non-English languages over the past 25 years. In 2001, the leading languages were Italian, Macedonian, Greek, German and Polish, a profile strongly shaped by twentieth-century European migration. By 2021, Mandarin ranked first, followed by Macedonian, Arabic, Greek and Italian. This suggests that the region’s linguistic, and therefore cultural, landscape became more diverse.
Currently, residents in the region collectively represent a wide range of languages and cultures, including but not limited to Mandarin, Cantonese, Arabic, Persian, Kurdish, Vietnamese, Swahili, Serbian, Thai, Croatian, Bosnian, Pashto, Urdu, Hindi, French, Italian, Greek, Polish, Spanish, Turkish, and Filipino. Some of these communities may be too small in population to be distinctly identified in Census data, yet they remain significant to schools, hospitals, libraries, community organisations, and local cultural life.
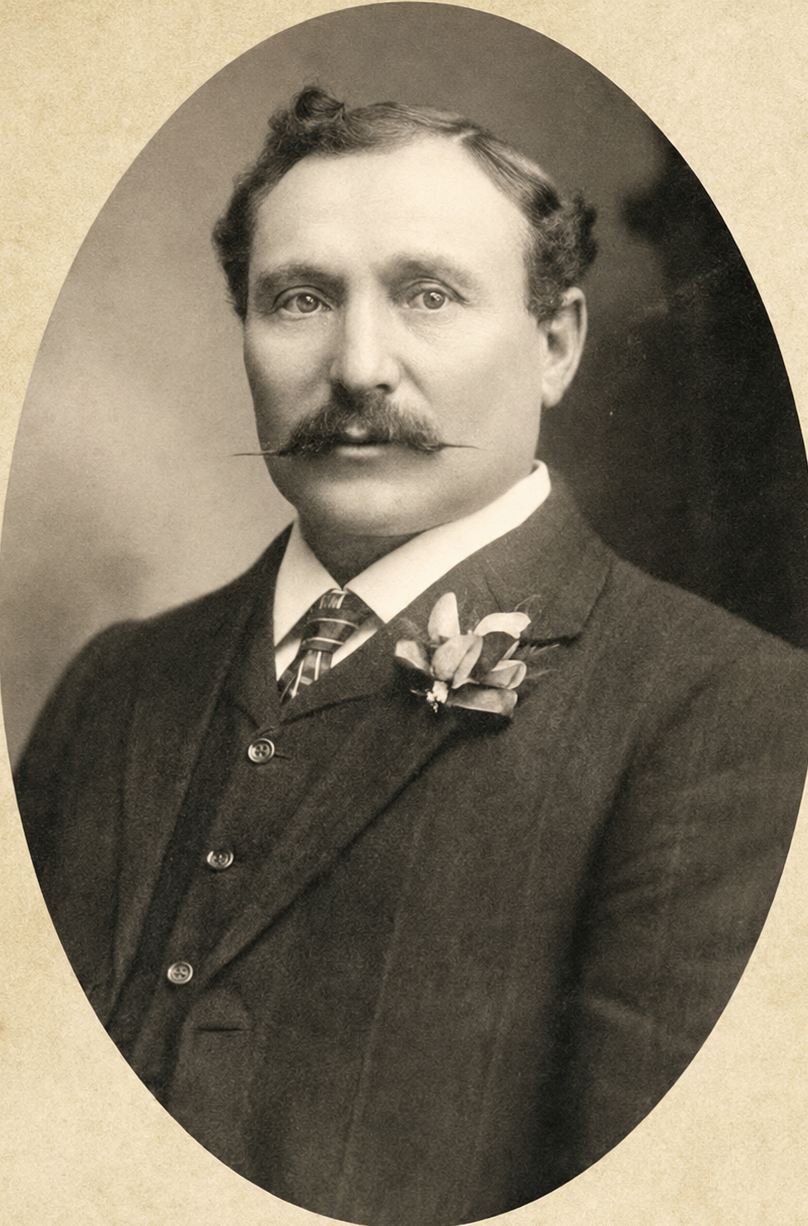
An example of such a contribution is the impact of Morris Light (1859-1929), a Russian Jewish migrant who left Russia to escape persecution. He emigrated to New South Wales, Australia, in 1884 and settled in Newcastle in 1886. Light served two terms as Mayor of Carrington in 1902 and 1903 and is credited as a catalyst for the early electrical illumination of Carrington streets. In 1924, Morris Light was elected Mayor of Newcastle and served until December 10, 1925. His achievements included the electrification of the tram service, the creation of a children’s park at Centennial Park, and initiating the construction of the city hall, offices, art gallery, museum, and a self-funded City Hall and Civic Theatre complex adjacent to the Town Hall.
https://uoncc.wordpress.com/tag/mayors-of-newcastle-australia/
Conclusion

Although Australian birth and English as a first language remain predominant, Newcastle and Lake Macquarie have become increasingly diverse regional urban centres outside the Sydney metropolitan area. This diversity is reflected in birthplace, parental migration, ancestry, language, religion, and First Nations identity. Heritage languages demonstrate both continuity and change: European languages remain present, while East Asian, South Asian, and Middle Eastern languages have become more prominent. Migrants have made significant contributions to the region’s development throughout its history. In 2021, most multilingual residents demonstrated strong proficiency in spoken English. Despite ongoing changes in the region’s cultural landscape, secularisation continues to be a defining feature of Newcastle’s cultural profile. The region’s diversity has contributed to its ongoing vitality.
We Thrive in Diversity.
References
Australian Bureau of Statistics. (2001). Newcastle (NSW), 2001 Census All persons QuickStats (Statistical District 1003). https://www.abs.gov.au/census/find-census-data/quickstats/2001/1003
Australian Bureau of Statistics. (2006). Newcastle (NSW), 2006 Census All persons QuickStats (Statistical District 1003). https://www.abs.gov.au/census/find-census-data/quickstats/2006/1003
Australian Bureau of Statistics. (2016). Newcastle, 2016 Census All persons QuickStats (Commonwealth Electoral Division CED131). https://www.abs.gov.au/census/find-census-data/quickstats/2016/CED131
Australian Bureau of Statistics. (2021). Newcastle, 2021 Census All persons QuickStats (Local Government Area LGA15900). https://www.abs.gov.au/census/find-census-data/quickstats/2021/LGA15900
Galvin, J. (1974). Origin and Settlement of Non-British Migrants in Newcastle, N.S.W. Australian Geographer, 12(6), 517-530.
Galvin, J. (1983). The Lettesi in Newcastle : a study of ethnic community formation, consolidation and integration, Thesis 866. University of Newcastle.
Tobler, R., Rohrlach, A., Soubrier, J. et al. Aboriginal mitogenomes reveal 50,000 years of regionalism in Australia. Nature 544, 180–184 (2017). https://doi.org/10.1038/nature21416
Tsounis, M. P. (1975). Greek commiunities in Australia. In C. Price, Greeks in Australia (pp. 19-65). Canberra: ANU Press.
One thought on “Cultural and Linguistic Diversity in Newcastle and Lake Macquarie”